


Dear Investor.
Zee here. Ever opened a stock chart and spot a blank space between two candles, as if the price skipped a step. That’s a gap, and it’s one of the quickest ways to see that sentiment changed overnight.
In this issue, we’ll break down what gap ups and gap downs are, why they happen, and how to read them without overthinking it.
What is a candlestick gap?
A candlestick chart normally flows smoothly: one candle ends, the next begins roughly where the last one left off. A gap happens when the next candle opens at a noticeably different price from where the previous one closed, leaving an empty space on the chart where no trading took place.
Think of it like a staircase with a missing step. The price didn’t walk through the in-between levels; it jumped over them.
Gaps mostly show up on daily charts, because markets close overnight. A lot can happen between the closing bell and the next morning’s open.
Gap up: the price jumps higher
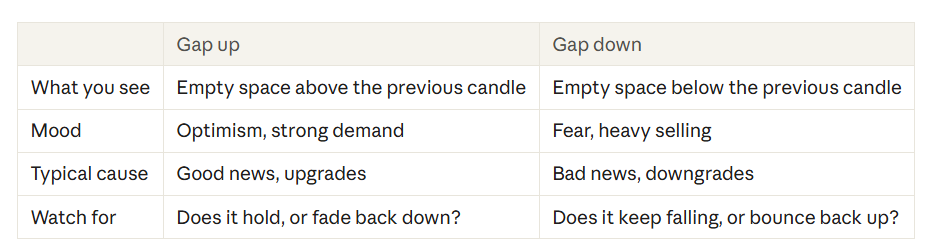
A gap up happens when today’s opening price is above yesterday’s high (or at least well above yesterday’s close). On the chart, you see an empty space above the previous candle.
What it usually means: buyers are more eager than sellers. Something overnight made people want the stock badly enough to pay a higher price right from the open.
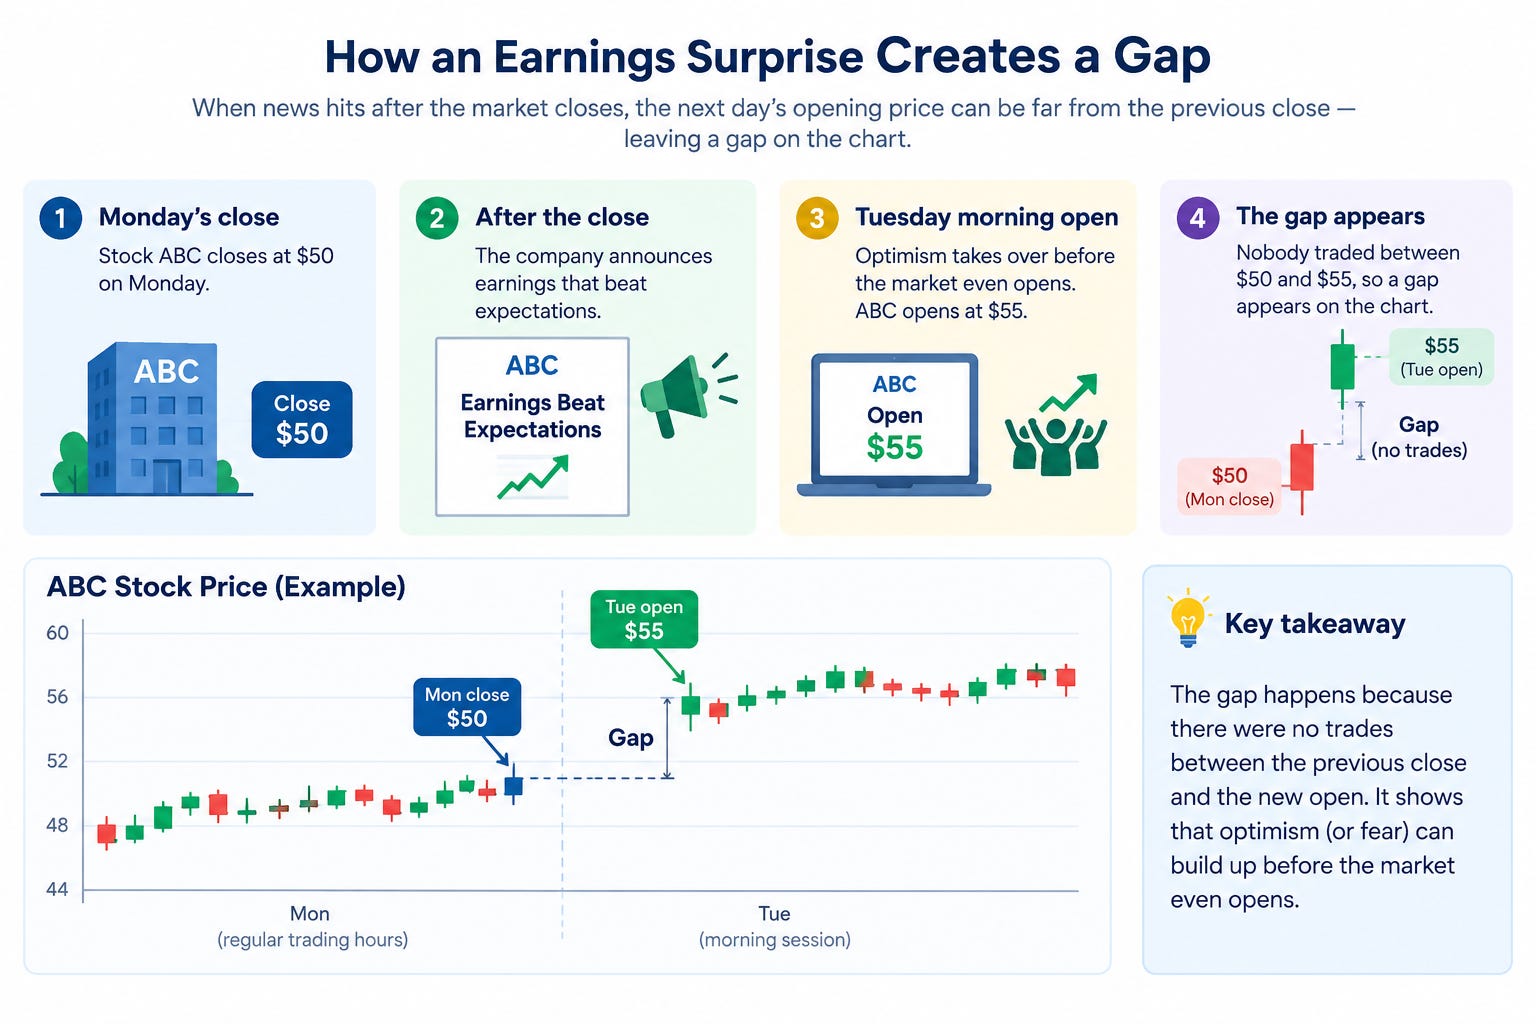
Example with illustration below: Stock ABC closes at $50 on Monday. After the close, the company announces earnings that beat expectations. On Tuesday morning, ABC opens at $55. Nobody traded between $50 and $55, so a gap appears on the chart. Optimism took over before the market even opened.
Gap down: the price drops lower
A gap down is the mirror image. Today’s open is below yesterday’s low (or well below yesterday’s close), leaving an empty space below the previous candle.
What it usually means: sellers are in control. Bad news or fear hit overnight, and people rushed to sell at whatever price they could get.
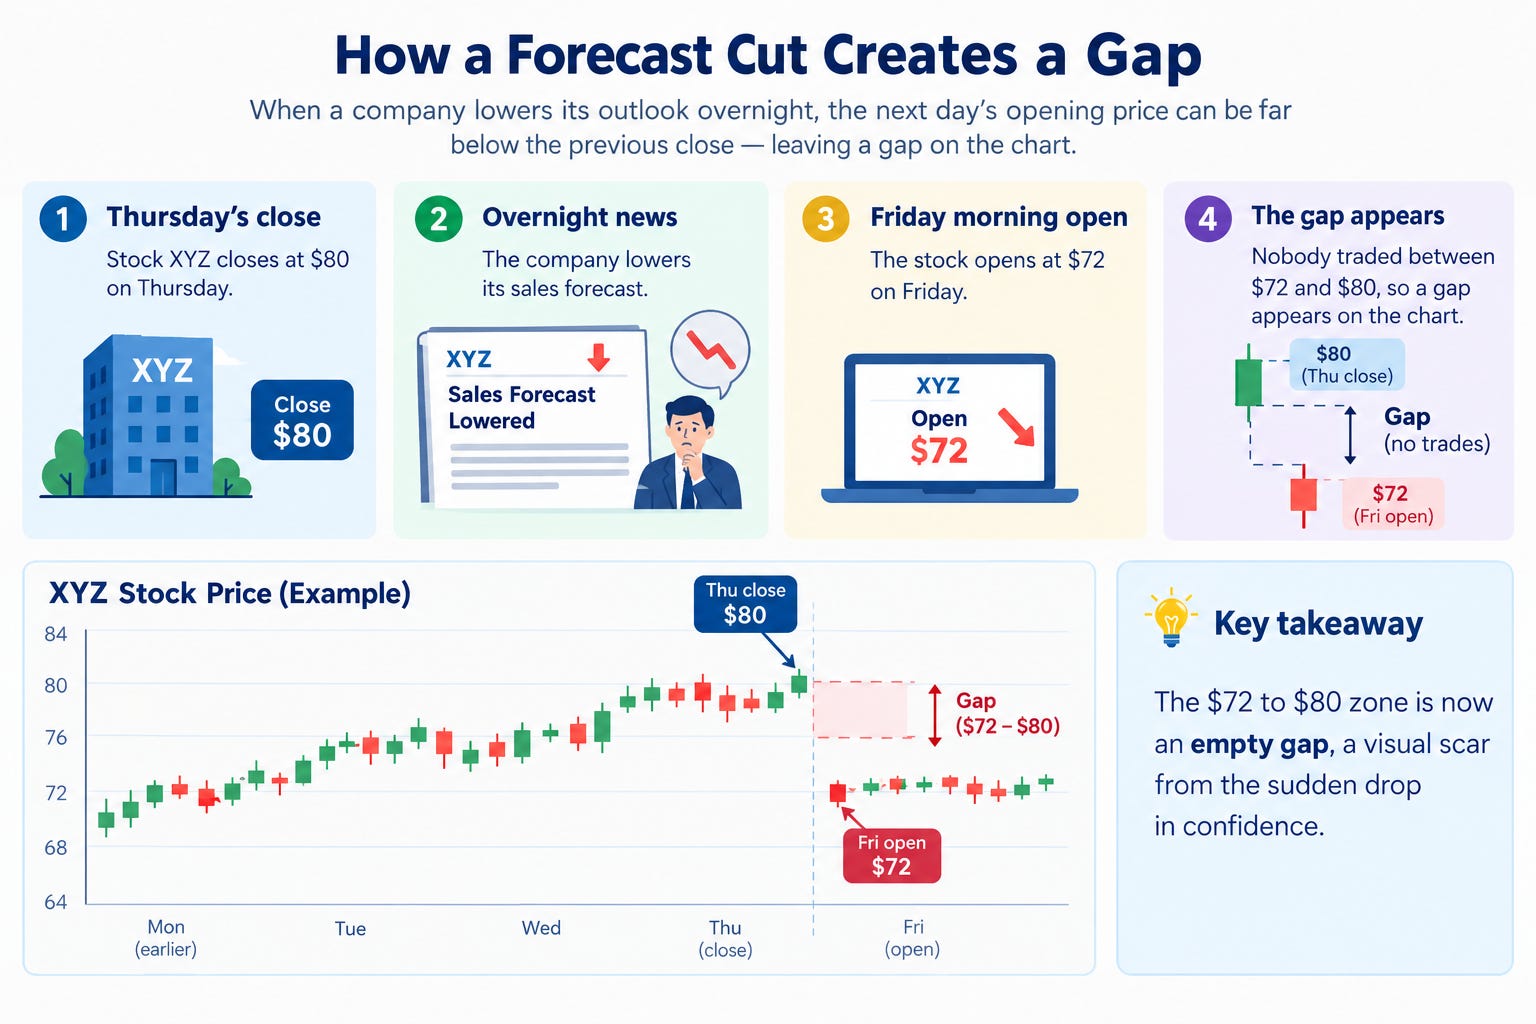
Example with illustration below: Stock XYZ closes at $80 on Thursday. Overnight, the company lowers its sales forecast. On Friday it opens at $72. The $72 to $80 zone is now an empty gap, a visual scar from the sudden drop in confidence.
Why do gaps happen?
Gaps appear when the balance between buyers and sellers shifts while the market is closed. Common triggers include:
Earnings reports (the most common cause)
Company news, such as a new product, a lawsuit, a merger or a leadership change
Economic data or central bank decisions
Global events or big moves in overseas markets
Analyst upgrades or downgrades
The bigger the surprise, the bigger the gap.
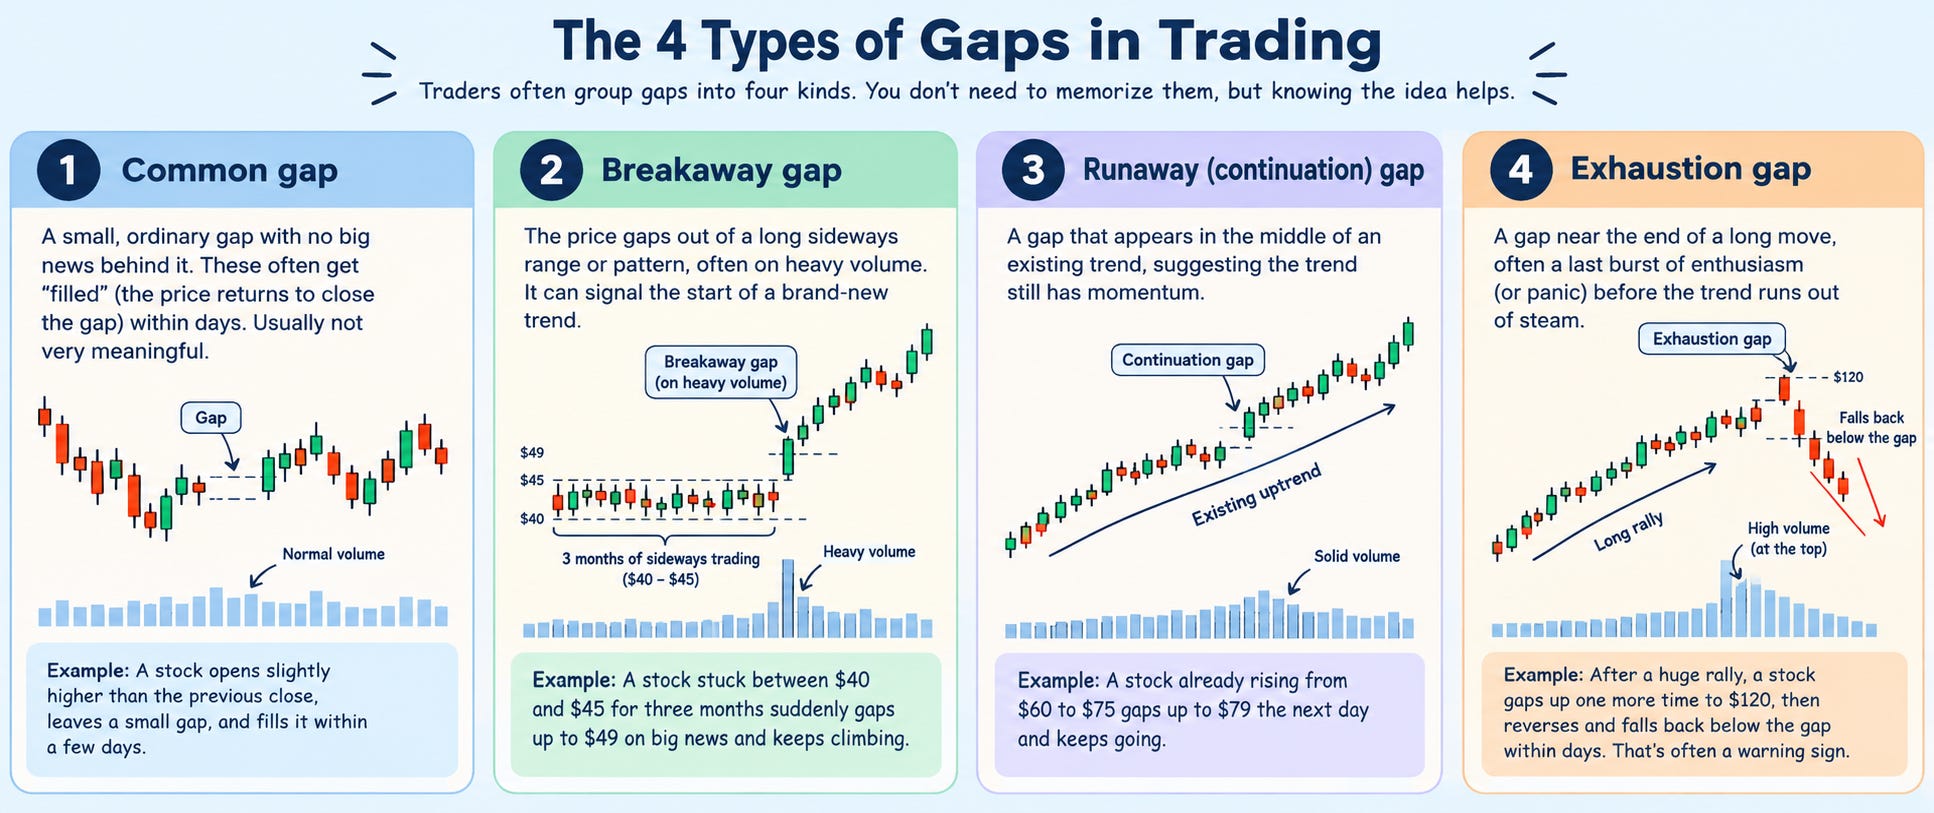
Not all gaps are equal: four types
Traders often group gaps into four kinds. You don’t need to memorize them, but knowing the idea helps.
Will the gap get filled?
You’ll often hear traders say “gaps always get filled.” A gap fill means the price eventually travels back and trades through the empty space.
It’s a popular saying, but it’s not a rule. Small gaps without news often do get filled. Big gaps driven by real, lasting news (like a major earnings beat) can stay open for months or even years. Treat gap-filling as a possibility, not a promise.
What to look at alongside a gap
A gap on its own is just a clue. These details help you read it better:
Volume. A gap on heavy volume shows strong conviction. A gap on light volume is easier to fade.
The news behind it. A gap caused by real change (earnings, a new contract) tends to hold better than one caused by rumor or hype.
Where it happens. A gap out of a long base is more interesting than a gap after a massive run-up.
What happens next. If price holds above a gap up (or below a gap down) instead of immediately reversing, the move has more credibility.
Quick cheat sheet
Disclaimer:
All information here is for educational purposes only. This is not financial advice. Please do your own research and speak with a licensed advisor before making any investment decisions. Past performance is not indicative of future returns. How we invest may not suit your investment goals and risk management profile.