


Dear Investors.
Zee here. Recently, I chance upon a few articles about how starting to invest at Age 50 can yield you a comfortable $1million sum by the time you retire at Age 65.
This is very interesting for the school, as we have a good number of pre-retirees students.
The pitch: you’re 50, you’ve got $50,000 saved, and you feel like the ship has sailed. But invest $2,500 a month into broad market ETFs for 15 years at 8% annual returns, and by 65, right when your pension payouts kick in, you’d have more than $1 million (excluding your pension).
It’s an appealing story. It’s also the kind of claim I’ve learned to be suspicious of, because “just invest and it 10x’s by retirement” is exactly the pitch that’s easiest to dress up with real-sounding numbers.
So instead of taking it at face value, I decided to actually run the math and check the return figures against the data, using a Future Value Calculator.
(I) Period (Meaning: No. of years): 65yo - 50yo= 15years
(II) Starting Amount: $50,000
(III) Interest rate (Meaning: Investment Gains per Year): 8% per year
(IV) Periodic Deposit (Meaning: How much money are you putting in per year): $2500 per month X 12 months= $30,000 per year
First, does the $1 million math actually work?
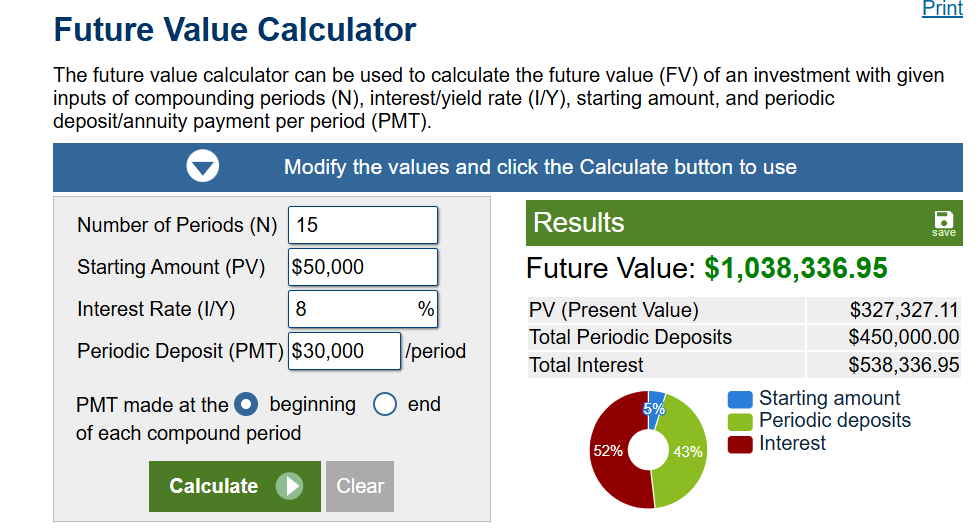
Yes, the math actually works. So that number holds up. It’s not a rounding trick, it’s just what compounding does over 15 years when you’re contributing $30,000 a year on top of a $50,000 base.
Nothing about this requires a hot stock pick or lucky timing. It’s arithmetic and long term compounding on good stocks or ETFs.
Second, are those “actual” return numbers real?
This is where I got more skeptical, because “10-year annualized return” is a number that swings a lot depending on the exact start and end date you pick. So I checked each one against current fund performance data.
S&P 500 (SPY/VOO) at 14.5% — This checks out. Multiple sources put the S&P 500’s rolling 10-year annualized total return (with dividends reinvested) somewhere in the 14–15% range as of late 2025 into 2026, driven largely by the post-2020 recovery and the AI-fueled run in mega-cap tech. So this figure is accurate and not cherry-picked.
Nasdaq-100 (QQQ) at 19.5% — Also roughly accurate, though it depends on exactly which day you measure from. I found the 10-year CAGR ending in 2025 cited at 18.6% from one source, and north of 20% from another measured a few months later in 2026. 19.5% sits right in the middle of that range, a fair, if optimistic, pick rather than an outlier.
Consumer Staples (XLP) at 8% — This is the sobering one. XLP’s 10-year total-return CAGR checks in right around 8% depending on the source — essentially identical to the “conservative” 8% baseline the post uses in its opening example. That’s not a coincidence; consumer staples (think Walmart, Coca-Cola, Procter & Gamble) is a defensive, low-growth sector by design.
Dow Jones Industrial Average (DIA) at 13% — This one holds up too. DIA’s 10-year annualized total return (dividends reinvested) has been quoted in the 12.4–13.5% range across sources, which is a bit behind the S&P 500 over this specific stretch since the Dow is more concentrated in older industrial and financial names and has less mega-cap tech exposure.
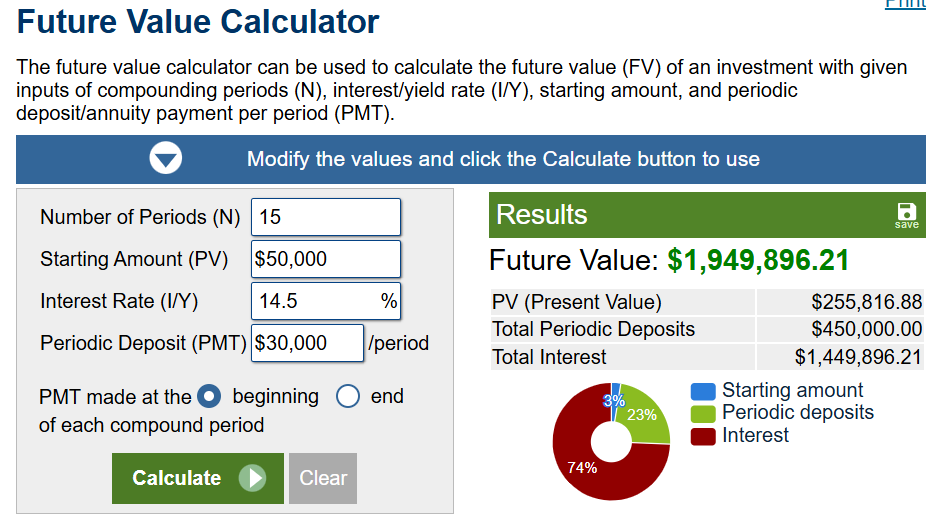
I plug in the same numbers but with the investment gains of index ETFs.
I re-ran the same compounding formula using each of those verified rates instead of 8%, and yes, the numbers in the post are consistent with the math:
At 14.5% (S&P 500): roughly $2.0 million
At 19.5% (Nasdaq-100): roughly $3.55 million
At 8% (Consumer Staples / XLP): roughly $1.03 million — basically the same as the original conservative baseline.
At 13% (Dow Jones / DOW): roughly $1.72 million.
Why this actually works?
It’s worth pausing on why the math produces such a big number, because it’s not magic — it’s three ordinary forces stacking on top of each other.
Compounding needs time more than it needs a big starting number. Of that ~$1.03 million at 8%, less than a fifth comes from the original $50,000 growing on its own. The bulk of it comes from 15 years of new contributions compounding alongside it. That’s the real insight hiding in this post: starting at 50 isn’t too late, because 15 years is still enough runway for compounding to do most of the heavy lifting, you don’t need 30 years, you need enough years.
Monthly contributions compound too, not just the lump sum. Each $2,500 deposited gets its own clock running from the day it lands. Money invested in year one has 15 years to grow; money invested in year 14 only has one. But because the contributions are so much larger in total ($450,000 over 15 years) than the starting balance, even the “late” dollars add up fast.
The higher return numbers aren’t invented — they reflect a real decade. The 2016–2025 stretch happened to include a strong post-pandemic recovery and an AI-driven boom in mega-cap tech, which is why QQQ’s 10-year numbers look so good right now.
So the honest version of “why this is true” is: it’s true because compounding rewards time invested, not luck, and the historical numbers are real, but the further the assumed return climbs above a conservative baseline, the more the plan’s success depends on the next 15 years resembling an unusually good 10-year stretch that already happened.
But here’s what the post doesn’t tell you
Everything above checks out on paper, which is exactly why I want to flag what’s missing, because a technically-accurate chart can still tell a misleading story if you don’t read the fine print.
A single 10-year return is a snapshot, not a promise. These figures depend heavily on the exact start and end dates chosen. Shift the window back two or three years, say, to include 2022’s brutal drawdown more heavily, or exclude the 2023–2025 AI rally, and the Nasdaq-100 and cybersecurity numbers look meaningfully different. QQQ has had 10-year stretches with annualized returns as low as ~10%, and even a negative stretch exists somewhere in its history depending on the window.
Volatility is the part the chart doesn’t show. QQQ dropped over 32% in 2022 alone. A 15-year plan that assumes steady 19.5% compounding ignores that these funds can and will have years where they lose a quarter of their value. Whether someone can stomach that at 50, with retirement approaching, is a real question the post skips entirely.
Concentration risk is real. Both QQQ and CIBR are far less diversified than a broad market fund, QQQ is heavily weighted toward a handful of mega-cap tech names, and CIBR is a single-sector bet. “Broad market ETF” in the opening example and “Nasdaq-100 / cybersecurity ETF” in the punchline aren’t really the same category of risk, even though the post presents them as a natural upgrade path.
Past performance really isn’t a guarantee, and the post says so in passing but then leans on those same numbers to make the emotional case (”time in the market beats timing the market”). Both things can be true at once: the historical numbers are accurate, and they’re still not a reliable forecast.
So, what should you actually do with this?
Here’s the part I don’t want to get lost under all the fact-checking: the core claim is true. 50 is not too late.
15 years is still real time, and the math above isn’t a sales trick, it’s what happens when you combine a modest starting balance, consistent contributions, and a diversified fund that grows with the broader market.
The biggest risk in a post like this was never the numbers. It was reading it, nodding, and then closing the tab and doing nothing, which is the one move guaranteed to make none of this math apply to you.
So if you’re 50, or 45, or honestly any age, and you’ve been telling yourself you’ve missed your window:
Work out your own numbers. Plug your actual savings and a monthly amount you can commit to into a compound interest calculator and see what 10 or 15 years actually looks like for you.
Pick the boring fund, not the exciting one. A broad, low-cost market ETF is a reasonable place to start. Chasing last decade’s best-performing sector fund because of a chart like this one is exactly the trap the numbers above warn against.
Automate the contribution. The plan above only works if the $2,500 (or whatever your number is) actually goes in every single month, market conditions and headlines aside. Set it up so it happens without you having to decide again each time.
Start this week, not “when things settle down.” Every month you wait is a month that doesn’t get to compound. The version of this plan that starts today will always beat a better-timed version that starts six months from now.
You don’t need to predict the next hot stock.
You need fifteen years, a simple plan, and to actually start it.
Disclaimer:
All information here is for educational purposes only. This is not financial advice. Please do your own research and speak with a licensed advisor before making any investment decisions. Past performance is not indicative of future returns. How we invest may not suit your investment goals and risk management profile.