
Is the US Stock Market Too High Right Now?
The numbers say yes. But the story, as always, is more nuanced than the headline.

Dear Investor.
Zee here. It is May 2026. The S&P 500 has clawed back most of its losses from the US-Iran war sell-off earlier this year.
Markets are rising again, sentiment is improving, and the financial headlines are turning cautiously optimistic.
Which makes right now exactly the right moment to ask an uncomfortable question: Are we paying too much?
In case you missed the last one...
Join us on Monday 25 May 2026 (7:30-915pm SGT), for our live Free webinar, where we cover:
* Our resilient investing strategy that we use in our public portfolio
* Stock Analysis: Will Visa be disrupted by AI?
Attendees will also get preview our new AI Powered Stock Market Simulator game where you’ll learn about your investing strengths and weakness.
👉🏼 Click here to reserve a spot. (LINK)
What “too high” actually means
When investors say a market is “overvalued,” they usually mean one thing: you are paying more for a dollar of corporate earnings than history suggests is reasonable.
The standard yardstick for this is the Price-to-Earnings (P/E) ratio, simply the price of the market divided by the earnings of its companies. If the S&P 500 trades at a P/E of 20, you are paying $20 for every $1 of annual profit. The higher the number, the more expensive stocks are relative to what businesses are actually earning.
Think of it like buying a rental property. If you pay $1,000,000 for a flat that earns $50,000 in rent per year, your “price-to-earnings” is 20x. If you pay $2,000,000 for the same flat, it’s 40x. The building hasn’t changed, only the price you’re willing to pay for it.
Here are the numbers
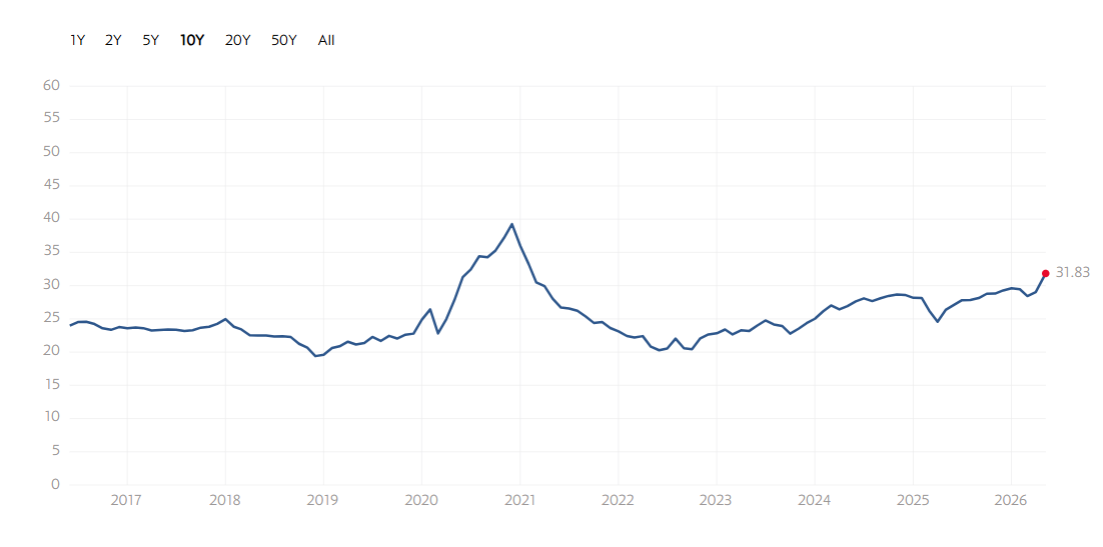
The S&P 500’s current trailing P/E sits at roughly 32x earnings, depending on which measure you use. The long-run historical average is closer to 16–18x.
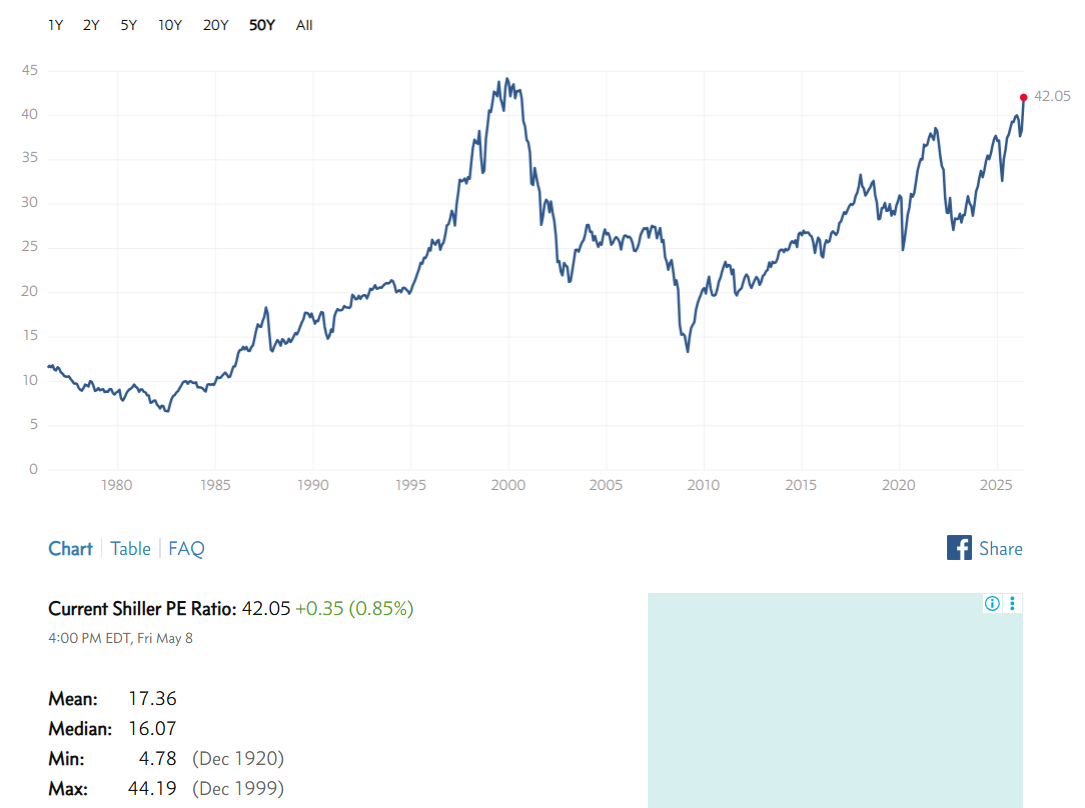
But the more revealing figure is the Shiller CAPE ratio, a smoothed version of P/E that averages inflation-adjusted earnings over ten years, ironing out short-term noise.
Robert Shiller, the Yale economist who called both the dot-com bubble and the 2008 housing crisis, developed it precisely because single-year earnings can be distorted.
As of 8th May 2026, the Shiller CAPE stands at approximately 42x. The long-run average is 17x.
So is a crash coming?
Not necessarily, and this is where nuance matters.
High valuations do not cause crashes. They simply mean that future returns are likely to be lower than they would be if you bought at cheaper prices. The market can stay expensive for years. It did through most of the late 1990s, right up until it didn’t.
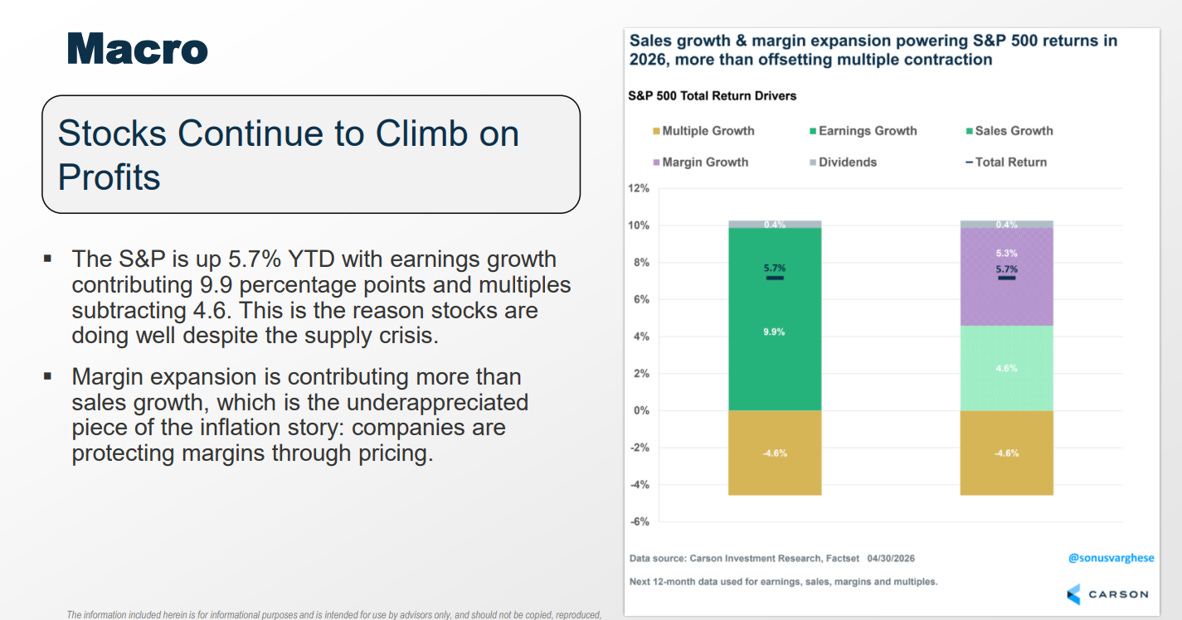
There are also legitimate reasons why today’s market might deserve a premium over its historical average. The S&P 500 is now dominated by large technology and software businesses, companies like Apple, Microsoft, and Nvidia that are structurally more profitable and faster-growing than the manufacturers and industrials that dominated the index decades ago.
Higher-quality businesses arguably deserve higher prices. Net profit margins climb as companies increases their prices.
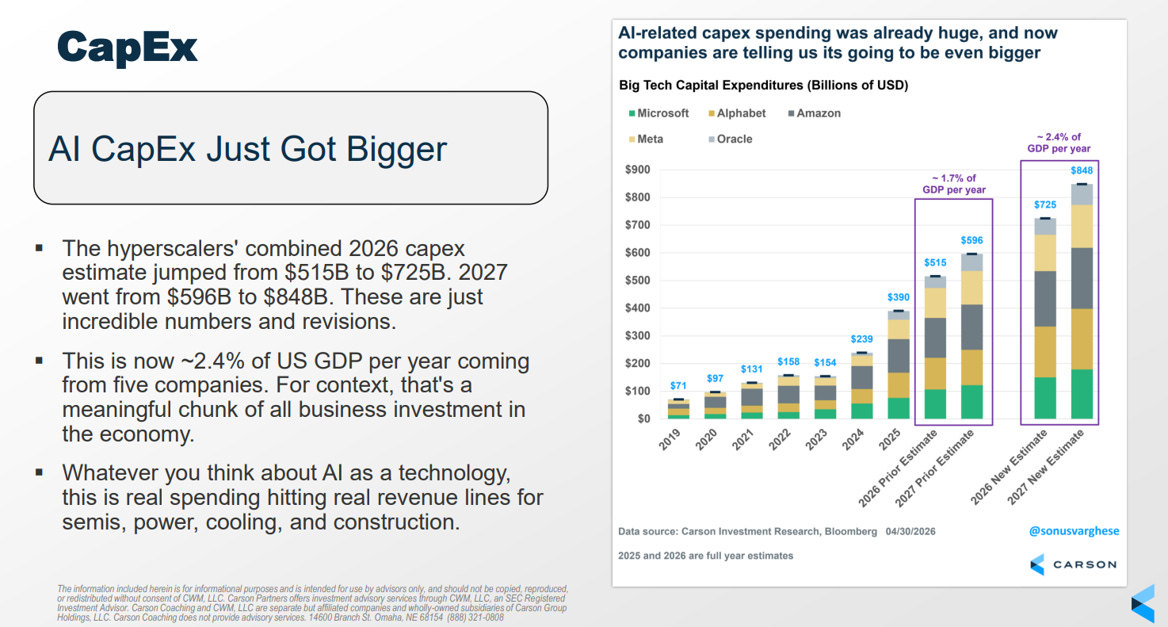
Then there is the AI Capital Expenditure (CAPEX) story and it is genuinely staggering. In 2026, Google, Amazon, Microsoft, and Meta are collectively on track to spend $725 billion on capital expenditure, up 77% from last year’s already-record $410 billion. Almost all of it is going into AI infrastructure: data centres, chips, and networking. Amazon’s CEO has said AI capacity is getting monetised “as fast as we install it.” Google Cloud just posted 63% year-on-year revenue growth.
This matters for valuation in two ways.
#1 This compresses near-term margins all that spending makes the market look more expensive on current earnings than it might actually be.
#2 If the bet pays off and AI drives a step-change in corporate productivity over the next five to ten years, earnings could grow fast enough to justify today’s prices in hindsight.
The CAPE ratio, which smooths earnings over a full decade, would be slow to reflect that kind of structural shift, potentially making the market look more overvalued than it truly is.
The takeaway
The US stock market is currently expensive by almost every historical measure. That is a fact, not a prediction.
Whether that expensiveness leads to a painful correction or gets resolved gradually through years of steady earnings growth, nobody knows.
The sensible path: time in market beats timing the market
Disclaimer:
All information here is for educational purposes only. This is not financial advice. Please do your own research and speak with a licensed advisor before making any investment decisions. Past performance is not indicative of future returns. How we invest may not suit your investment goals and risk management profile.