
September Selloffs: Wall Street's Annual Clearance Sale
100 Years of Market Data Can't Be Wrong?


Dear Investors,
As summer fades and we enter September, it's time to address the elephant in the room: September is historically the stock market's selloffs month.
While 2024 defied this trend with impressive gains, the long-term data paints a clear picture that every investor should understand.
For nearly a century, September has held the dubious honor of being the only month to consistently deliver negative average returns. Think about that for a moment. In a market system designed to trend upward over time, one month has managed to buck that trend for generations. It's as if September exists solely to remind us that gravity still works on Wall Street.
But here's where it gets interesting: the very fact that September is so predictably challenging creates a setup that savvy investors have learned to exploit. While the masses flee in panic, those who understand the seasonal mechanics often find their best opportunities emerging from the chaos.
Aaron, a close friend and now mentee, albeit i’m learning from him as much as he learns from me, with an astute and sharp mind for economics shared many U.S. mutual funds and investment firms have financial years ending September 30. To close the books, managers may:
(i) Take profits on stocks that performed well, locking in gains.
(ii) Sell losers to realize tax losses and offset gains.
(iii) Sell to cover fund management fees
This creates selling pressure across the market.
As we dive into the data behind September's reputation, remember that knowledge is power, but only when coupled with the discipline to take action on it.
The September Effect: The Numbers Don't Lie
Since 1926, U.S. large-cap stocks have lost an average 0.9% in September, according to data from Morningstar Direct. September is the only month during that nearly century-long period in which investors experienced an average loss, making it unique among all 12 months of the year.
The statistics are remarkably consistent across different timeframes and indices:
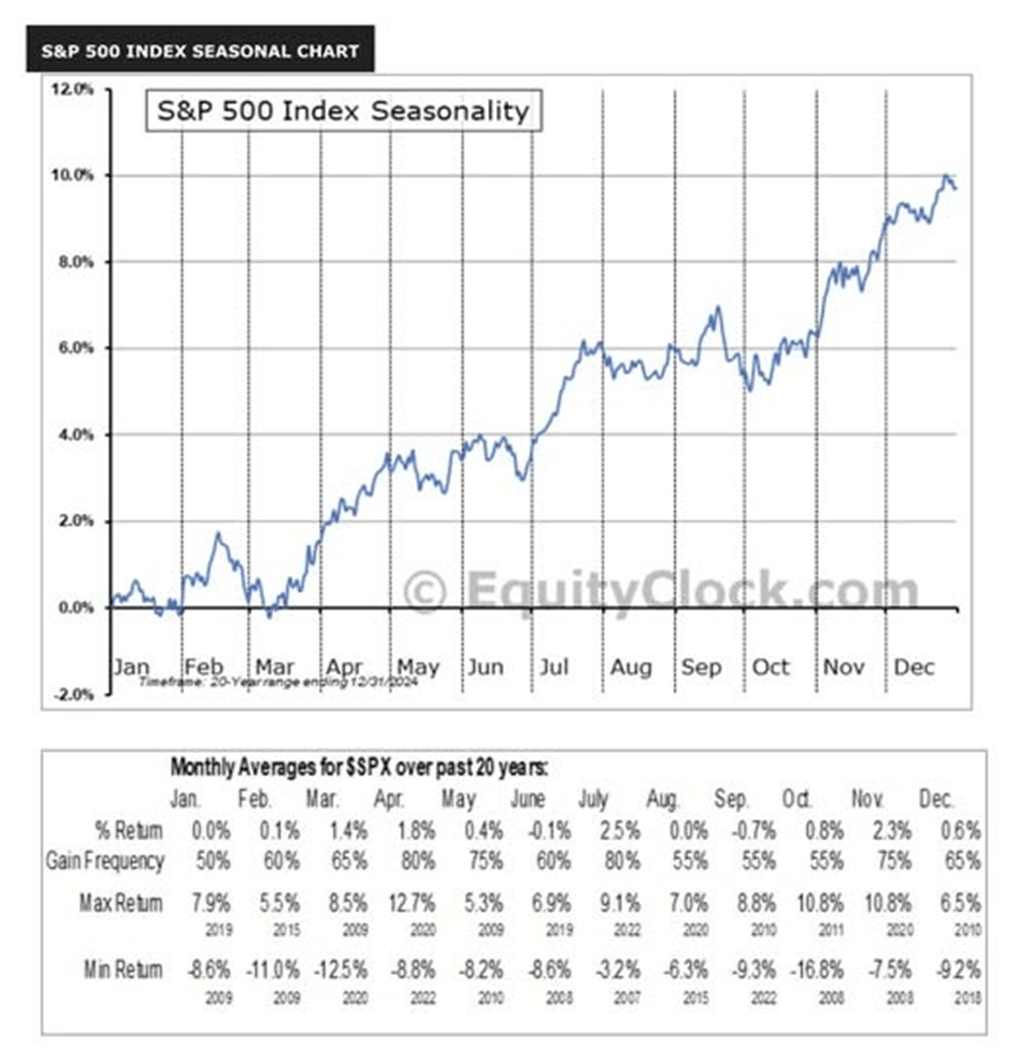
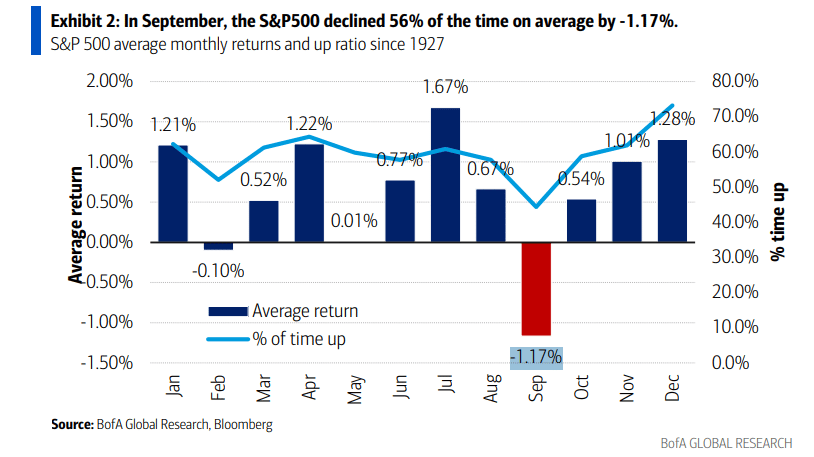
The S&P 500 has fallen an average of 1.1% in September and posted positive returns just 45% of the time since 1928
The Dow Jones Industrial Average has averaged a 1.1% monthly decline since 1897, ending higher in only 42% of Septembers
Stocks have declined in September 55% of the time since 1928
September has historically been one of the worst months of the year. It is the only month of the year with a negative average return in the S&P 500 and Nasdaq 100
Why September Struggles: Understanding the Mechanics
The September Effect in stocks is usually driven by lower summer trading volume, mutual fund schedules and bond market activity. Several factors converge to create this seasonal weakness:
Portfolio Rebalancing: As the third quarter ends, institutional investors often rebalance portfolios, potentially creating selling pressure.
Vacation's End: After a period of lower activity in July and August, September often brings rebalancing and profit-taking, causing stock prices to dip.
Mutual Fund Activity: Many mutual funds conduct year-end planning and tax-loss selling strategies, contributing to increased volatility.
Psychological Factors: The "back to business" mentality after summer can bring renewed focus on economic uncertainties and geopolitical risks.
September 2024: A Historical Anomaly
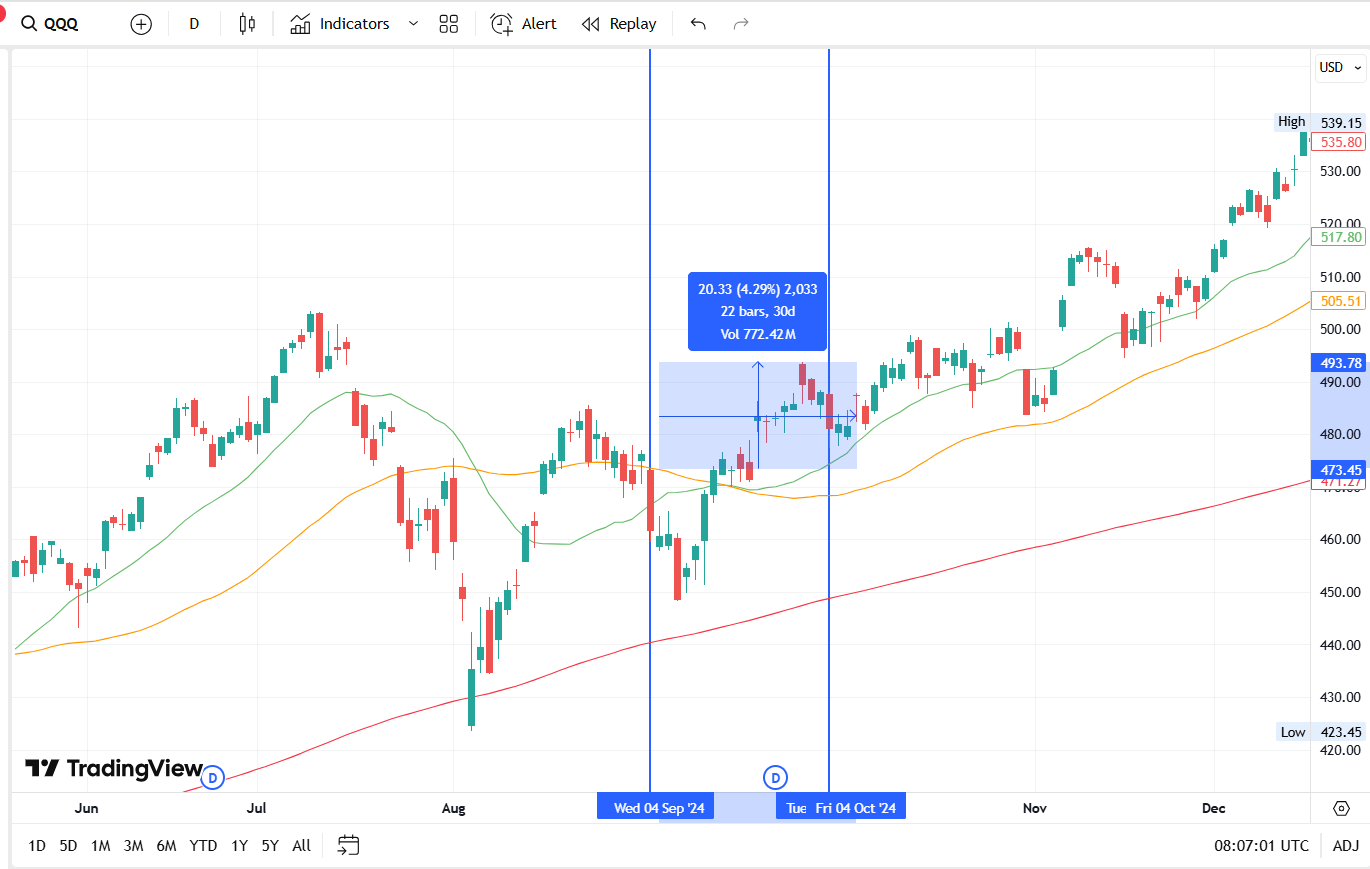
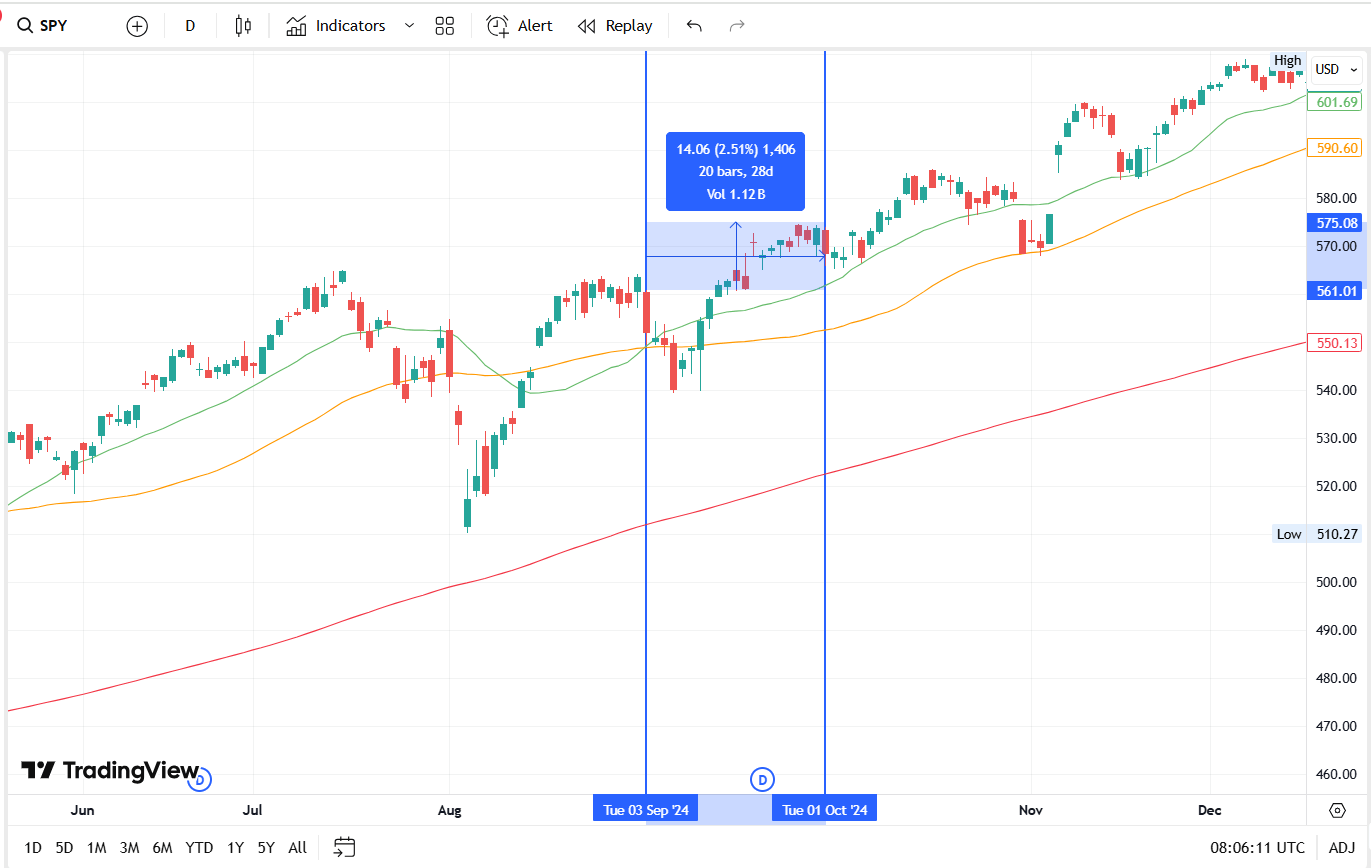
Interestingly, September 2024 bucked this historical trend dramatically. The S&P 500 was up 2.02% in September, bringing its YTD return to 20.81%, while the Nasdaq Composite added 2.8%. This performance was so unusual that the S&P 500 just had its best September in 11 years.
The strong performance was largely driven by the Federal Reserve's decision to cut interest rates. In a bold move, the Federal Reserve voted to lower interest rates by half a percentage point, marking its first reduction since 2020. This monetary policy shift provided a significant tailwind that overwhelmed the typical September seasonal headwinds.
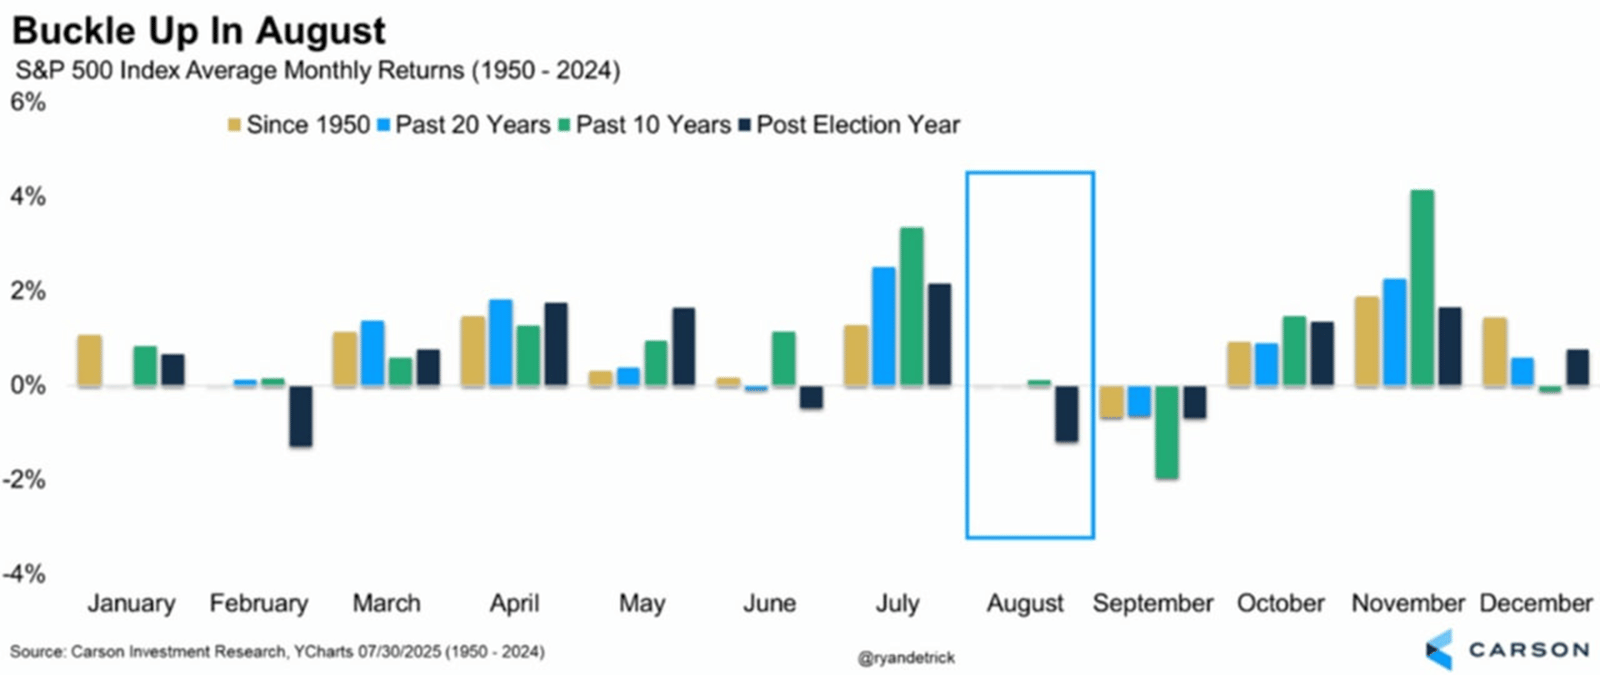
The Bigger Picture: August-September Tandem
Since 1945, August and September have historically been the weakest performing back-to-back months for the S&P 500, with the average return for both months in negative territory. These are the only two months that share this back-to-back trend.
This two-month period often represents a seasonal low point in market sentiment, making it historically one of the most challenging periods for equity investors.
What This Means for Your Investment Strategy
For Long-Term Investors: Stay the Course
The data suggests that September weakness, when it occurs, is typically temporary. According to data from Bank of America, when the S&P 500 hits a record in August, September finishes lower 61% of the time, but these declines are often followed by strong fourth-quarter rallies.
For Tactical Investors: Consider the Opportunity
September's historical weakness has often created attractive entry points. The key is distinguishing between fundamental deterioration and seasonal/technical selling pressure. When September declines are driven by seasonal factors rather than economic fundamentals, they can present compelling opportunities for patient capital.
Risk Management Remains Crucial
While September's reputation is based on averages, individual years can vary dramatically. As we saw in 2024, strong fundamental factors (like Fed policy changes) can overwhelm seasonal patterns. Always maintain appropriate diversification and risk controls regardless of seasonal expectations.
Looking Ahead: October and Beyond
Historically, October has been a month of recovery following September weakness. The fourth quarter has traditionally been one of the strongest periods for equity markets, suggesting that September struggles often set up attractive opportunities for the final months of the year.
The Bottom Line
Remember, markets climb a wall of worry, and September has historically been when that wall feels tallest.
Here is how we are investing in September:
(i) Prepare a shopping list of High quality stocks and ETFs
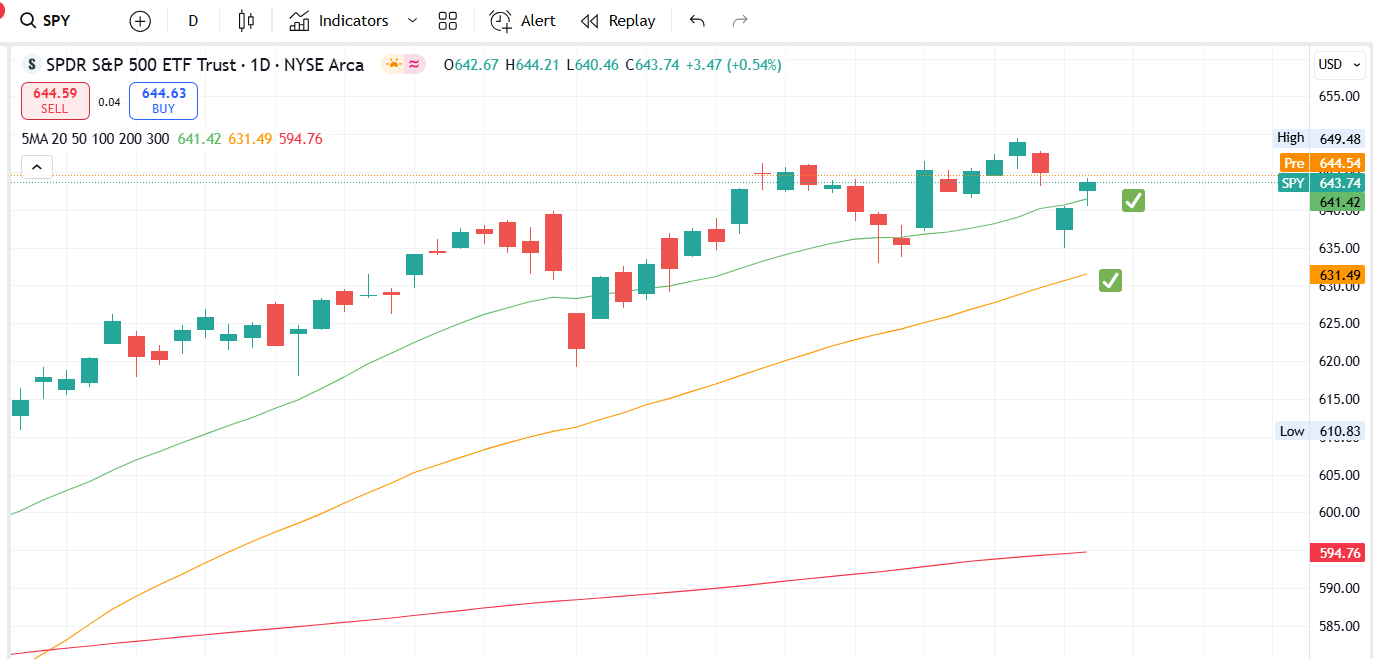
(ii) Don’t time the market. Dollar Cost Average (DCA) as the market dips using the Moving Averages as a guide (see below).
Disclaimer:
All information here is for educational purposes only. This is not financial advice. Please do your own research and speak with a licensed advisor before making any investment decisions. Past performance is not indicative of future returns.