
Overpriced or Overhyped?
A Look at Today’s Overvalued Markets.

Dear Investor.
Zee here. This Saturday, we are taking a break of KISS: Kintsugi Stock Saturdays, to address the elephant in the room.
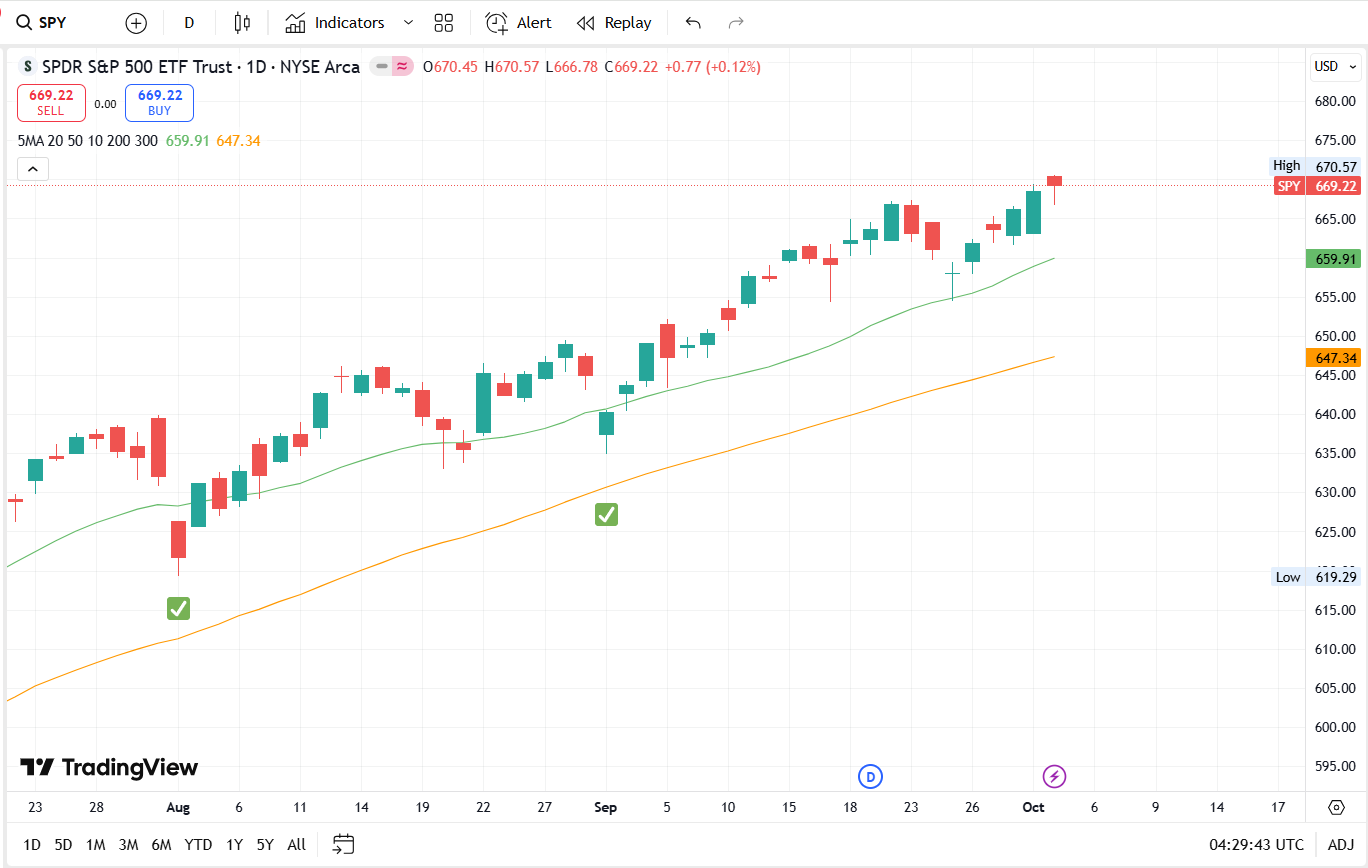
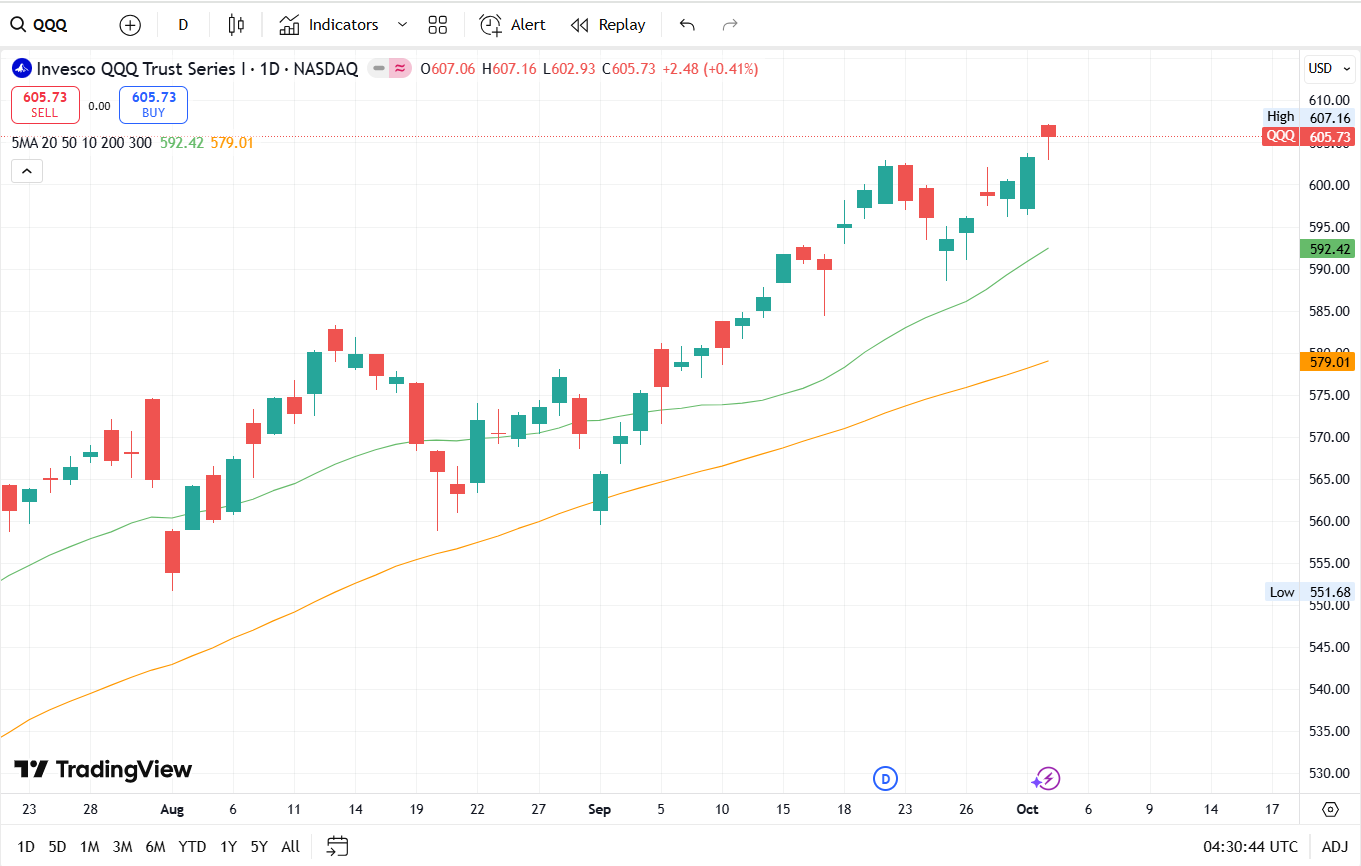
If you’ve been following the stock market lately, you’ve probably noticed the S&P 500 reaching new highs. In fact, Q3 achieved the most All-Time Highs (ATHs).

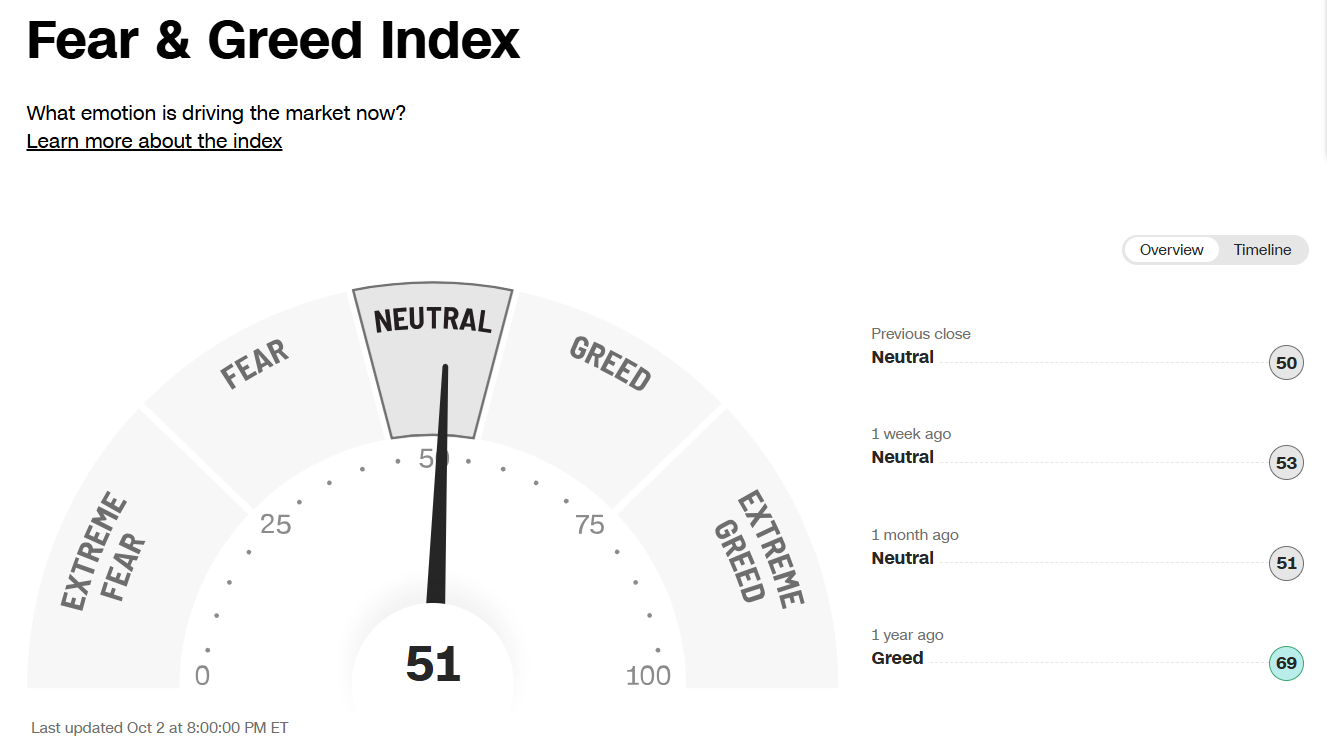
But yet, the Fear & Greed Index remains neutral and not within the Greed and Extreme Greed.
Is it true that only a handful equities drive markets higher and higher?
Is this the moment to sell everything?
Does “new high” mean “too expensive”?
Let us look at 2 indicators to decide.
Sidenote: Next Tuesday (7th Oct), at 830pm (GMT+8), We’re breaking down a stock that we’re studying as an opportunity live on Zoom, using the same methods we apply in our own investing.
We’ll also be sharing more about our investing course that has helped over 2000+ students (to date) achieve their goals. No fluff, just clear insights you can use.
Sign up for free here
Indicator #1: The Shiller PE Ratio
Named after Nobel Prize-winning economist Robert Shiller, the Shiller PE ratio (also called the CAPE ratio, which stands for Cyclically Adjusted Price-to-Earnings) is one of the most respected valuation tools.
Here’s how it works: Instead of comparing stock prices to just one year of company earnings (which can be distorted by temporary booms or busts), the Shiller PE averages earnings over the past 10 years and adjusts for inflation. This smooths out the ups and downs of economic cycles and gives us a clearer picture.

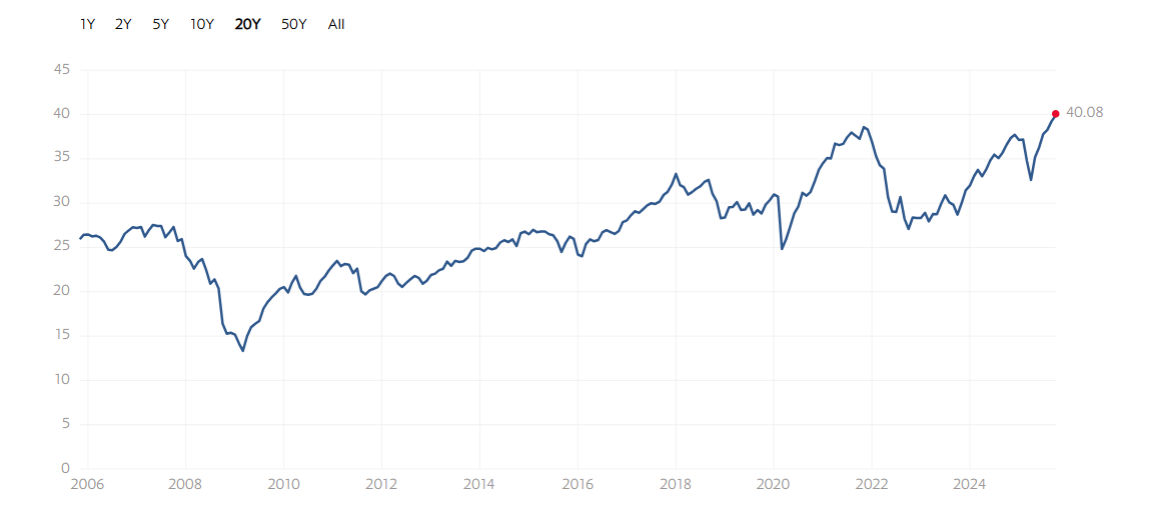
The current reading: The Shiller PE ratio stands at around 40, well above its historical average of about 17. In fact, it’s currently higher than it’s been at any point except the late 1990s dot-com bubble and briefly in 2021.
What this means: You’re paying roughly $40 for every $1 of average earnings companies generate. This indicates the market is overheated.
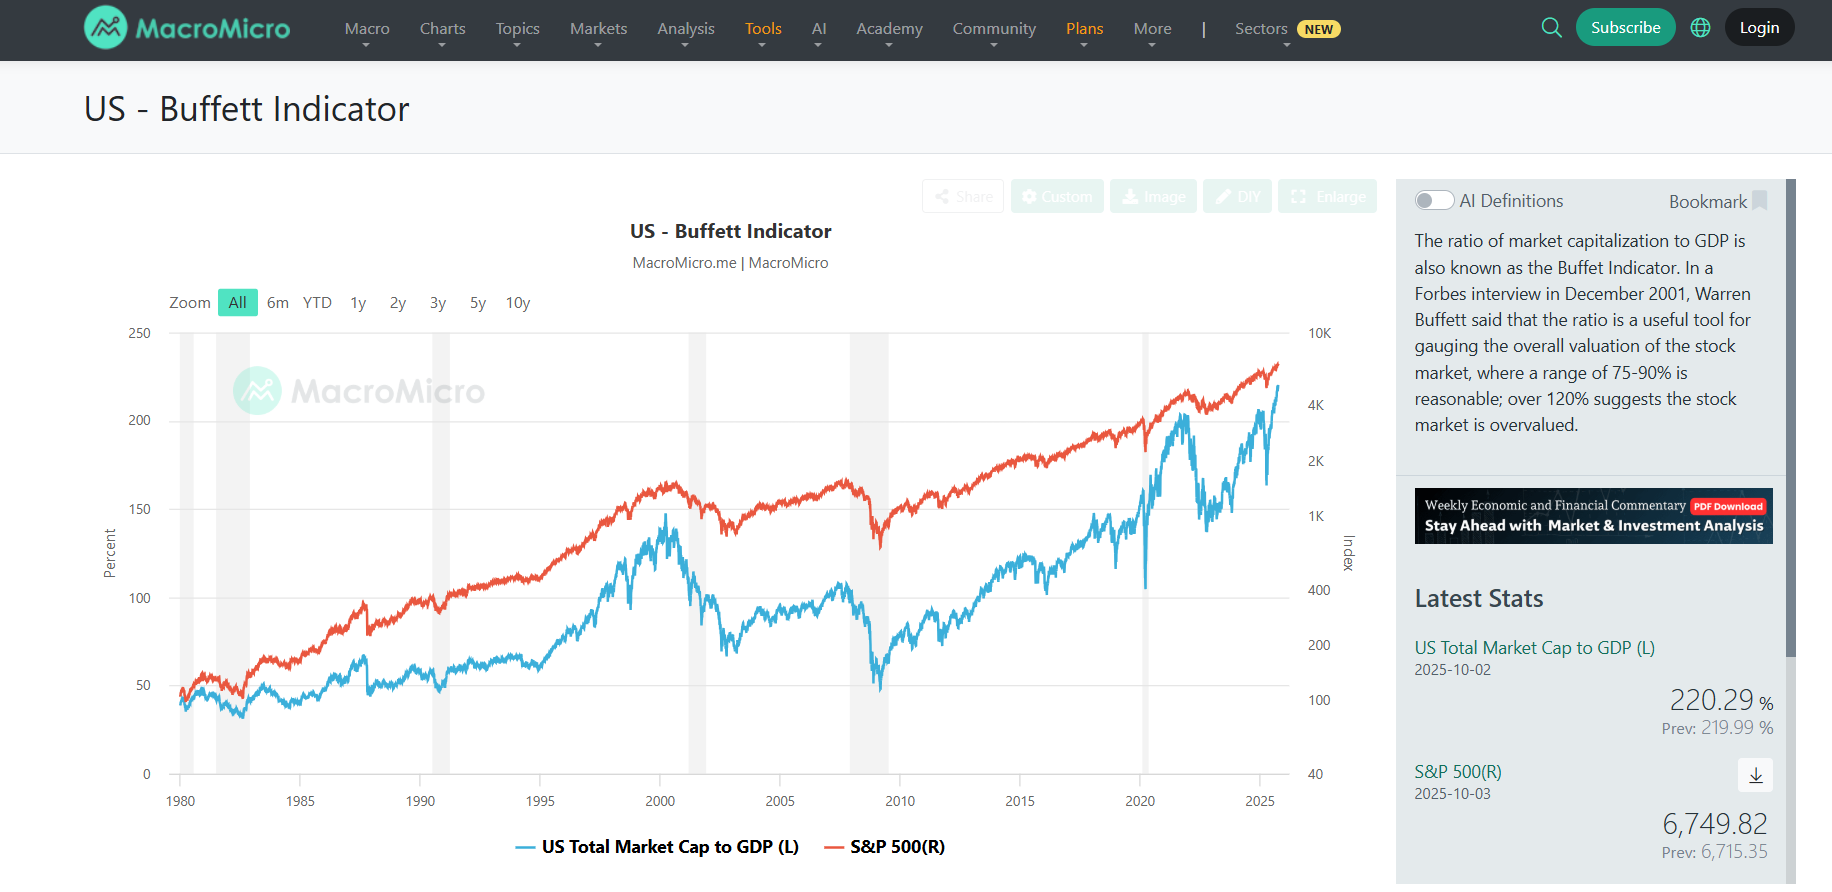
Indicator #2: Market Cap-to-GDP Ratio (“The Buffett Indicator”)
Warren Buffett (in 2001) once called this “probably the best single measure of where valuations stand at any given moment”, hence it was dubbed the Buffett Indicator.
It’s beautifully simple: take the total value of all U.S. stocks and divide it by the size of the entire U.S. economy (GDP).
Essentially, this is America’s Market Value vs. Its Economy

The logic: Over the long run, the stock market can’t grow much faster than the economy itself. If it does, something’s out of whack.
The current reading: The Buffett Indicator currently sits at around 217-220%, meaning the stock market is worth more than twice the size of the annual U.S. economy. That’s roughly 2.2 standard deviations above the historical average.
What this means: By this measure, the market appears significantly overvalued. Buffett himself has suggested that a ratio between 75-90% represents reasonable value, and anything over 120% suggests overvaluation.
But Wait, Is Overvalued the Whole Story?
Here’s where it gets nuanced. These metrics are flashing warning signs, but that doesn’t mean you should panic or rush to sell everything.
Here’s why:
The world has changed. Interest rates, though rising from historic lows, have been lower on average since the 1980s, which justifies somewhat higher valuations. Companies today also invest heavily in intangible assets like software and intellectual property, which can make traditional metrics look more expensive than they really are.
Timing is impossible. Markets can stay “overvalued” for years. The late 1990s taught us this lesson, valuations were excessive in 1996, yet the market climbed for another 4 years before correcting.
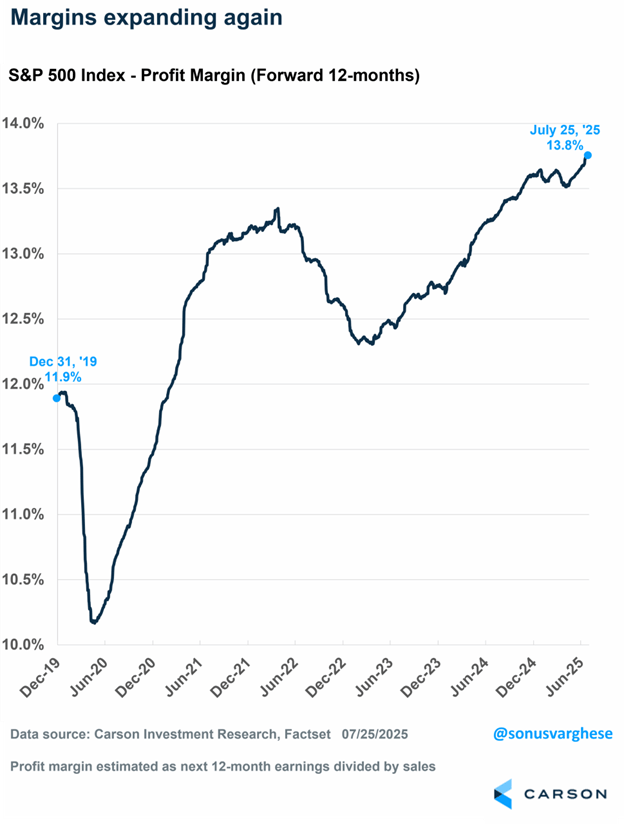
Earnings still matter. If corporate profits continue growing strongly, particularly driven by productivity gains from technology and AI, stocks could “grow into” their valuations over time.
The Bottom Line
Yes, by traditional measures like the Shiller PE ratio and Buffett Indicator, the stock market does appear expensive, significantly so.
These aren’t reasons to panic, but they are reasons to be thoughtful.
Markets at high valuations tend to deliver lower future returns and face greater downside risks when corrections come.
What are we doing?
#1. Taking Profit on some of our profitable trades by partial exits, to extract cash.
#2. Going through our Watchlist and then wait to reinvest cash.
More here on our portfolio.
Disclaimer:
All information here is for educational purposes only. This is not financial advice. Please do your own research and speak with a licensed advisor before making any investment decisions. Past performance is not indicative of future returns. How we invest may not suit your investment goals and risk management profile.